Dennis de BonoIndependent estate agent, brokered by eXp
Area
Marlow, SL7The Marlow post town and postcode district
Data to
25 September 2026Land Registry, downloaded 29 October 2026
01
The twelve months to 30 September 2026
At a glance
Marlow's typical sale over the last twelve months was £650,100, which is 4.4% below the twelve months before it. Over the same period the upper quartile rose 5.0%. The middle of the market softened and the top did not.
Median sale
£650,100
−4.4% on the year
The middle sale of 251. Lead on this figure, not the mean.
Sales
251
−13.1% on the year
Open-market sales registered in SL7, against 289 the year before.
Homes at £750,000 and above
100
39.8% of all sales
Exactly one hundred. Two in every five Marlow sales.
Upper quartile
£940,000
+5.0% on the year
A quarter of sales were above this. It rose while the median fell.
HM Land Registry Price Paid Data, postcode district SL7, 1 October 2025 to 30 September 2026. Repossessions, company transfers and other non-market sales are excluded.
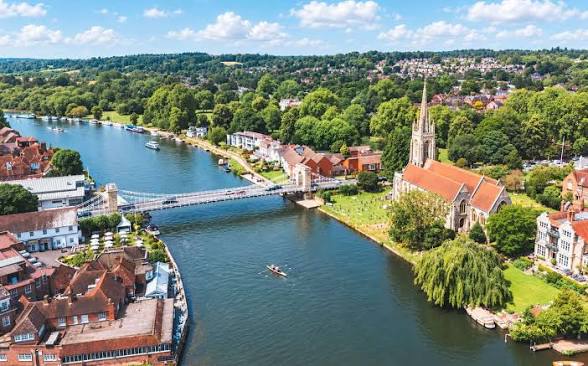
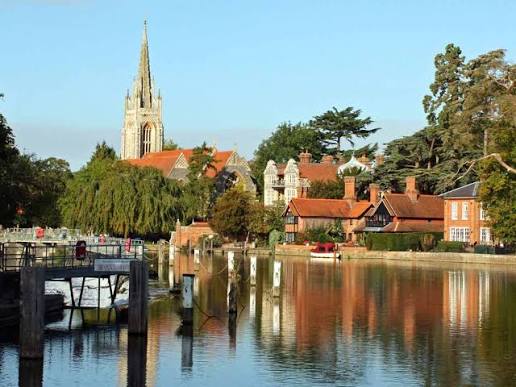
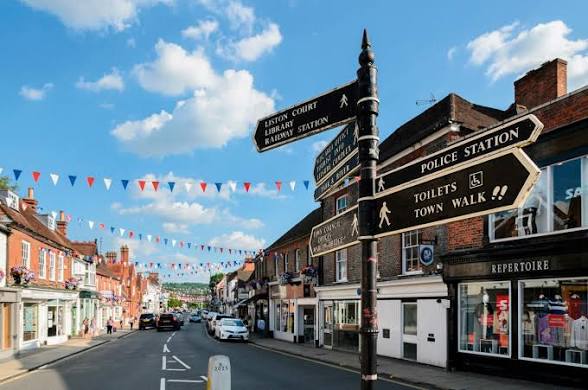
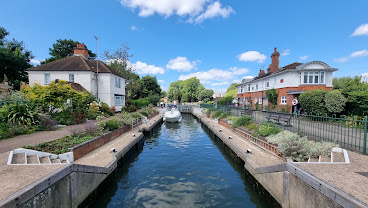
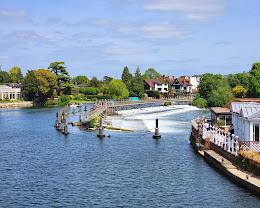
All Saints, across the ThamesMarlow High StreetMarlow Lock
02
1 October 2025 to 30 September 2026
The last twelve months
251 open-market sales registered in SL7 in the year, against 289 in the twelve months before. Volume fell 13.1%. The median fell 4.4%. The upper quartile rose 5.0%.
Last 12 months against the previous 12
Last 12 months
Previous 12 months
Change
Sales
251
289
−13.1%
Median
£650,100
£680,000
−4.4%
Mean
£754,612
£805,218
−6.3%
Lower quartile
£465,000
£500,000
Upper quartile
£940,000
£895,000
+5.0%
90th percentile
£1,250,000
£1,300,000
Highest
£5,150,000
£5,300,000
Lowest
£160,000
£180,000
Read the median, not the mean
The median sale was £650,100. The mean was £754,612, roughly £105,000 higher. The gap is the work of a thin top tail: three sales in the year passed £2m and one reached £5,150,000. The median describes the typical Marlow sale. The mean describes the arithmetic of those few large ones.
The year in one line
The median fell 4.4%. The upper quartile rose 5.0%.
The softening sits in the middle of the market. Above £940,000, where a quarter of Marlow sales happen, prices went the other way. Section 05 shows where in the stock that split falls.
1.6%
New build, 4 sales of 251. Marlow sells second-hand stock.
22.3%
Leasehold, 56 sales of 251, close to the flat and maisonette share.
03
1 July 2026 to 30 September 2026
The last three months
Registration lag · read this before the table
Land Registry records a sale when it is registered, not when it completes, and that lag runs weeks to months. July, August and September 2026 currently show 15, 22 and 12 sales against a running rate near 25 a month. The most recent months are still filling as sales register, so volumes for the last quarter will rise.
The prices move with them. 49 sales is a small sample, and the sales still to register are not spread evenly across the price range.
Last 3 months against the same 3 months of 2025
Last 3 months
Same 3 months 2025
Sales
49
75
Median
£740,000
£720,000
Mean
£804,456
£773,037
Lower quartile
£580,000
£485,000
Upper quartile
£965,000
£898,000
Highest
£1,800,000
£2,000,000
The quarter's median of £740,000 is the highest half-year median in the whole six-year series. What it shows is that the sales which have registered so far in the quarter sit towards the larger end of Marlow's stock: the lower quartile jumped from £485,000 to £580,000, which is a change in the mix rather than a change in what a given home is worth.
What it does not show is that the market has turned. A part quarter of 49 sales cannot carry that conclusion, and this report does not draw it. The figure to watch is the full year in section 02.
04
Calendar years, 2019 to 2026
Five years
A strong 2021 and 2022, a dip through 2023, a recovery in 2024, a softer 2025, and 2026 running ahead of all of them on median while doing less volume.
Open-market sales by calendar year
Year
Sales
Median
Mean
Lower quartile
Upper quartile
2019
261
£565,000
2020
249
£585,000
2021
419
£605,000
£710,139
£457,000
£822,000
2022
325
£672,000
£816,357
£455,000
£916,000
2023
240
£660,000
£781,414
£485,000
£905,000
2024
301
£680,000
£815,564
£500,000
£890,000
2025
297
£650,000
£751,738
£480,000
£875,000
2026 to 25 Sep
155
£700,000
£798,301
£475,000
£995,000
2019 and 2020 are given for context. Mean and quartile figures for those two years are not carried in this report.
On median, 2021 to 2026 to date reads £605,000 to £700,000, a rise of 15.7%. Comparing full years only, 2021 to 2025, the rise is 7.4%. Both are our own arithmetic on two figures from the table above, not a published index.
Open-market sales a year
Postcode district SL7, 2019 to 2026. The 2026 bar is a part year and is drawn open-topped.
Settled years
2026, part year to 25 September
Volume is the larger story. 419 sales registered in 2021. The run rate now is near 250 a year, and 2026 stands at 155 with the last three months still filling. Marlow is pricing a little higher on fewer transactions than it did five years ago.
Half-year median sale price
Postcode district SL7, 2021 H1 to 2026 H2. The closing segment is a part period.
Median, settled half-years
2026 H2, part period, 49 sales
The half-year series is the cleanest view of the price trend because it smooths the month-to-month noise without hiding a turn. It shows a market that has traded in a band between £630,000 and £695,000 for four years. The final point is a part period and is drawn as one.
Half-year medians
Period
Median
Sales
Period
Median
Sales
2021 H1
£590,000
253
2024 H1
£685,000
124
2021 H2
£632,500
166
2024 H2
£675,000
177
2022 H1
£643,500
129
2025 H1
£670,000
126
2022 H2
£690,000
196
2025 H2
£630,000
171
2023 H1
£685,000
107
2026 H1
£695,000
106
2023 H2
£650,000
133
2026 H2
£740,000
49, part period
05
By property type, last 12 months
Whole of market
Detached homes are 36.3% of Marlow's sales and set the top of the market. Flats and maisonettes are 19.9% and set the bottom. Between them sit the terraces, which are the town's largest single band of family housing after the detached.
Median, mean and quartiles by property type, last 12 months
Type
Sales
Share
Median
Mean
Lower quartile
Upper quartile
Median change
Detached
91
36.3%
£940,000
£1,080,602
£765,000
£1,200,000
+9.3%
Semi-detached
42
16.7%
£624,500
£701,012
£540,000
£785,000
−8.8%
Terraced
68
27.1%
£577,500
£634,626
£470,000
£690,000
+0.4%
Flat / maisonette
50
19.9%
£345,000
£369,513
£250,000
£415,000
−1.3%
Change column compares the median with the previous twelve months, when detached read £860,000 on 113 sales, semi-detached £685,000 on 65, terraced £575,000 on 67 and flats £349,475 on 44.
Median by property type
Postcode district SL7. Last twelve months against the previous twelve, with the change on the right.
Last 12 months, to 30 Sep 2026
Previous 12 months
The divergence · the most useful finding in this report
Detached medians rose 9.3%. Semi-detached fell 8.8%.
Detached moved from £860,000 to £940,000. Semi-detached moved from £685,000 to £624,500. The two halves of the same town's family housing went opposite ways in the same twelve months, and nothing in the wider backdrop separates them.
Part of the semi-detached fall is a change in what sold rather than a fall in what a given house is worth: volume dropped from 65 sales to 42, and its upper quartile fell from £863,000 to £785,000, so the larger semis that used to trade did not trade this year. For an owner the practical point is that a detached valuation and a semi-detached valuation in Marlow are now moving on different evidence and should not be set off the same town-wide figure.
+9.3%
Detached median, 91 sales, £940,000
−8.8%
Semi-detached median, 42 sales, £624,500
06
Distribution, last 12 months
Price bands
Three in five Marlow sales land below £750,000. Two in five land above it. The two bottom bands are almost exactly the same size, which is why the median sits where it does.
Share of sales by price band
Postcode district SL7, 1 October 2025 to 30 September 2026. 251 sales.
The shape matters for anyone setting a guide price. Marlow has real depth either side of £500,000 and real depth between £750,000 and £1.5m. Above £1.5m it has ten sales a year, and a home priced there is competing in a market of tens rather than hundreds.
07
Buckinghamshire, labelled as such
Pounds per square foot
There is no reliable Marlow figure for pounds per square foot in open data. Land Registry Price Paid Data carries no floor area, so one cannot be derived from the sales in this report, and the sources that publish a town-level rate could not be reached. The figures below are county figures.
Houses
£430
per square foot
Flats
£359
per square foot
New build
£428
per square foot
Older property
£422
per square foot
Buckinghamshire, October 2025 to September 2026. Plumplot, derived from HM Land Registry Price Paid Data. These are county rates, not Marlow rates.
Marlow transacts above the county average on every measure in this report that the two share, so the Marlow rate will sit above £430 a square foot. This report does not put a number on it, because any number it printed would be an estimate dressed as a measurement.
For the direction of travel, the same source puts the county at £4.6k per square metre in every year from 2022 to 2025 and £4.5k in 2026. England and Wales reads £3.6k in 2026. The county rate has been flat for four years and is about a quarter above the national one.
08
The high-value segment
Homes above £750,000
Exactly 100 homes sold at £750,000 or more in the twelve months to 30 September 2026. Two in every five Marlow sales. Their median was £1,000,000.
The segment against the previous 12 months
Last 12 months
Previous 12 months
Sales
100
120
Share of all sales
39.8%
41.5%
Median
£1,000,000
£975,000
Mean
£1,149,627
£1,212,110
Lower quartile
£880,000
£850,000
Upper quartile
£1,250,000
£1,300,000
90th percentile
£1,550,000
£2,050,000
Highest
£5,150,000
£5,300,000
By property type within the segment, last 12 months
Type
Sales
Share of segment
Median
Detached
72
72.0%
£1,000,000
Terraced
13
13.0%
£975,000
Semi-detached
12
12.0%
£997,500
Flat / maisonette
3
3.0%
£825,000
Detached homes are 72% of the segment and all four types appear in it, which is the thing a town-wide average hides: a Marlow terrace at £975,000 and a Marlow semi at £997,500 are ordinary events, not outliers.
Eight years of the segment
More of what sells is at the top
Share of all sales at £750,000 and above
Postcode district SL7, 2019 to 2026. The 2026 bar is a part year and is drawn open-topped.
Settled years
2026, part year to 25 September
The segment over eight years
Year
Sales at £750k and above
Share of all sales
Median
Mean
2019
69
26.4%
£1,020,000
£1,101,198
2020
73
29.3%
£975,000
£1,291,049
2021
134
32.0%
£950,000
£1,161,930
2022
124
38.2%
£1,062,500
£1,317,011
2023
88
36.7%
£1,012,500
£1,251,465
2024
124
41.2%
£967,500
£1,245,455
2025
112
37.7%
£972,500
£1,157,653
2026 to 25 Sep
70
45.2%
£1,000,000
£1,169,767
What the eight years say
Marlow has not got dearer at the top. More of what sells is at the top.
The segment's median has moved inside a band between £950,000 and £1,062,500 across eight years and reads £1,000,000 now. Its share of all sales has gone from 26.4% in 2019 to 45.2% in 2026 to date. The price of a large Marlow house has held; the proportion of the town's transactions that are large Marlow houses has risen by about two thirds.
The mechanism is visible in section 04: volume fell from 419 sales in 2021 to a run rate near 250, and the fall landed hardest on the cheaper half of the market. The top of Marlow keeps transacting. The bottom of it transacts less than it used to.
Highest recorded sales, last twelve months
Highest recorded sales, 1 October 2025 to 30 September 2026
Price
Street
Date
Type
£5,150,000
Quarry Wood Road, SL7 1RE
7 May 2026
Detached
£3,400,000
West Street, SL7 2BY
11 Dec 2025
Detached
£2,500,000
Spinfield Lane West, SL7 2DB
9 Jan 2026
Detached
£1,995,000
Quarry Wood, SL7 1RF
8 Apr 2026
Detached
£1,950,000
Wethered Park, SL7 2BH
16 Oct 2025
Detached
£1,950,000
Moyleen Rise, SL7 2DP
20 Apr 2026
Detached
£1,800,000
Henley Road, SL7 2ED
1 Sep 2026
Detached
£1,800,000
School Lane, SL7 2HJ
28 Jan 2026
Terraced
£1,765,000
Spinfield Lane, SL7 2LD
20 Jul 2026
Detached
£1,550,000
Frieth Road, SL7 2QU
4 Aug 2026
Detached
Street and postcode only. House names are on the public record but are not printed here. Dates are registration dates.
09
Against the county, the region and the country
Marlow in context
Marlow's median of £650,100 sits against a Buckinghamshire average of £477,000 and an England average of £293,525. The typical Marlow home is worth roughly 2.2 times the England figure.
Marlow against its county, region and country
Area
Figure
Measure
Change on the year
Period
Source
Marlow, SL7
£650,100
Median
−4.4%
Oct 2025 to Sep 2026
Land Registry Price Paid
Buckinghamshire
£477,000
Average
0.0%
Aug 2026
ONS
South East
£379,953
Average
−0.8%
Aug 2026
UK House Price Index
England
£293,525
Average
+0.4%
Aug 2026
UK House Price Index
United Kingdom
£273,037
Average
+0.9%
Aug 2026
UK House Price Index
Median against average
Ours is a median, the comparators are averages. A median is the middle sale of the set. An average is the arithmetic mean of all of them, and in a market with a long top tail it sits above the median. Marlow's own mean, £754,612, is about £105,000 above its median.
So the ratio above is an order of magnitude, not a precise multiple. Compared mean to mean, the gap between Marlow and England would be wider than 2.2 times, not narrower.
By type, county against town
Buckinghamshire average against Marlow median, by type
Type
Buckinghamshire average
Marlow median
Detached
£852,000
£940,000
Semi-detached
£470,000
£624,500
Terraced
£378,000
£577,500
Flat / maisonette
£233,000
£345,000
County figures are ONS averages for August 2026. Marlow figures are Land Registry medians for the twelve months to 30 September 2026. The two are different measures over different periods and are set side by side for scale, not for arithmetic.
The county flat figure fell 2.7% on the year. Buckinghamshire's average rent reads £1,486 a month and rose 5.8%. Across the United Kingdom, mortgage approvals in August 2026 ran at 54,900 against a six-month average of 60,100, which is the clearest single sign of why transaction volumes are where they are.
Nearby towns
Twelve-month medians, Marlow and nearby towns
Town
Median
Marlow
£650,100
Amersham
£740,000
Princes Risborough
£520,000
Chesham
£462,500
High Wycombe
£425,000
Aylesbury
£373,000
Twelve-month medians. Marlow is our own figure from Land Registry Price Paid Data. The five comparator towns are taken from Construction Capital's Q3 2026 Marlow review, an automatically generated page also derived from Land Registry data. We have not rebuilt those five from source.
10
Postcode district SL7
The map
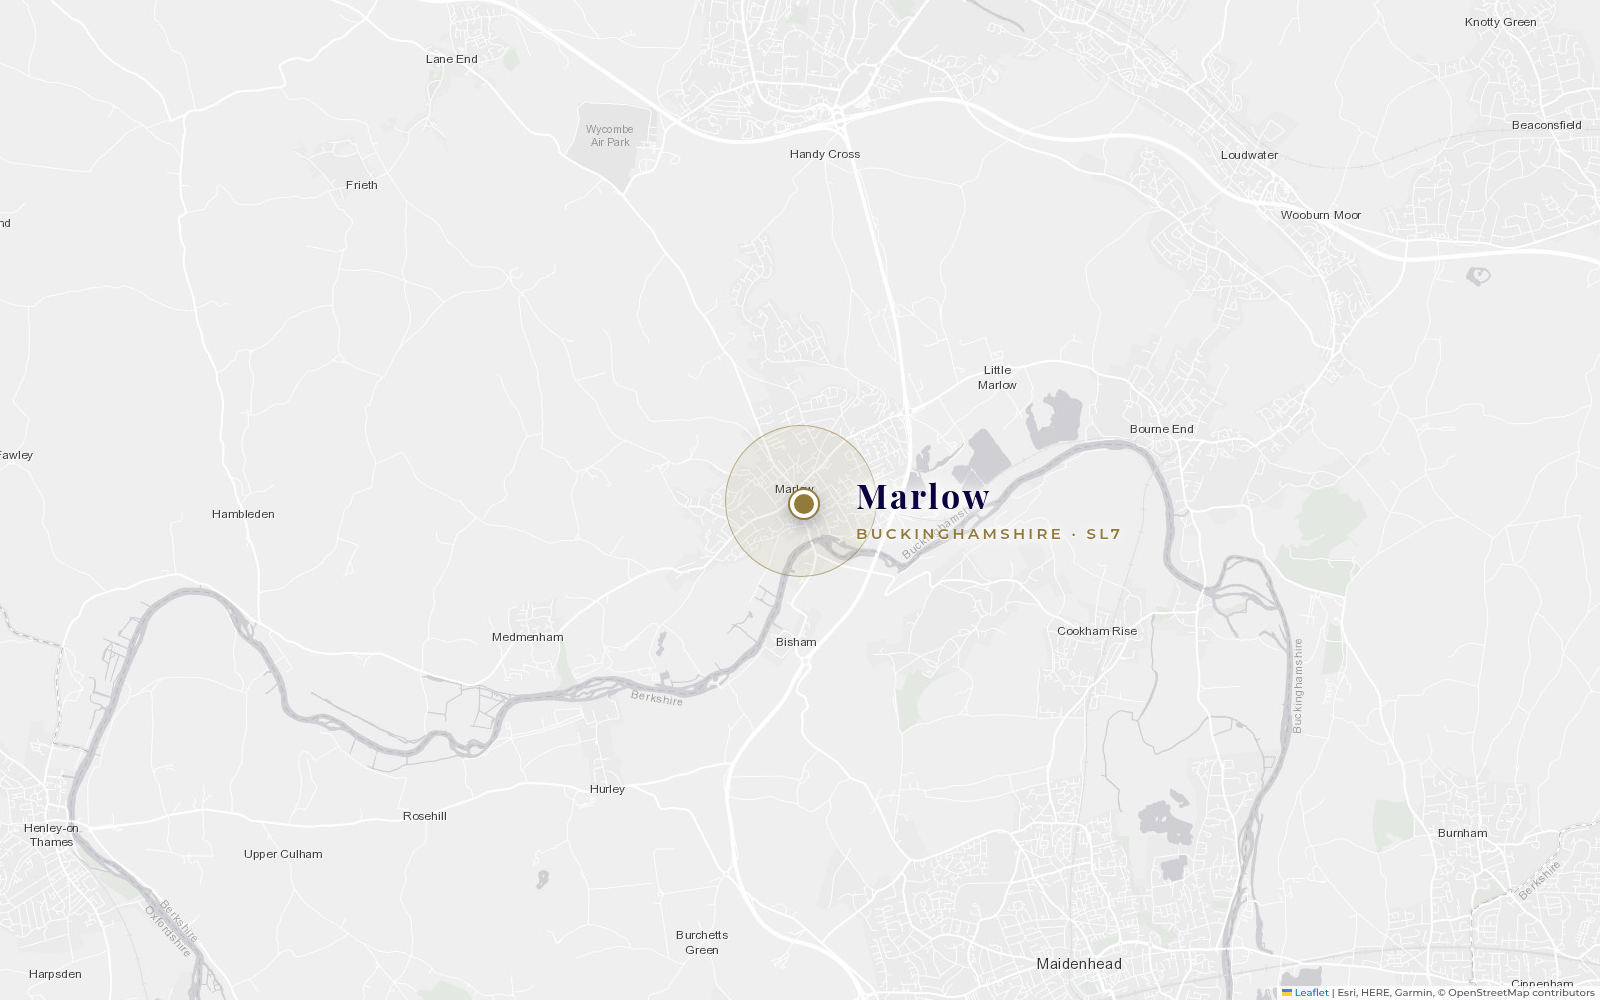
Postcode district SL7 is the Marlow post town. Every one of the 2,540 Land Registry transactions recorded in it since January 2019 carries the town value MARLOW, so for this report the postcode district and the post town are the same area. The pin marks the town centre; the district reaches into the Chilterns to the north and along the Thames to either side of it.
Base map: Esri light grey canvas. Attribution is carried in the lower right of the image.
11
How this report was built
Method and sources
Marlow Weir
The sales figures in this report come from HM Land Registry Price Paid Data for postcode district SL7, downloaded on 29 October 2026 and covering 2,247 open-market sales since January 2019. Repossessions, company transfers and other non-market sales are excluded, which is why these figures run below the ones the portals publish.
Land Registry records a sale when it registers rather than when it completes, so the most recent months are still filling and those volumes will rise. Where a figure comes from somewhere else it is named on the page. Square-foot rates are published at county level only; no reliable Marlow-level rate exists in open data.
What this report does not tell you
No pounds per square foot for Marlow. The county rate is given in section 07 and labelled as the county rate.
No average time to sell, and no gap between asking price and sold price. Neither is published for Marlow in a source we could reach and verify.
No current stock, new listings or price reductions. Those describe what is on the market now. This report describes what has sold.
No forecast. The tables end on 25 September 2026 and so does the report.
Sources
HM Land Registry Price Paid DataPrimary source. Bulk files for 2019 to 2026, filtered to postcode district SL7, Category A sales only. 2,540 transactions in the district, 2,247 of them open market. Downloaded 29 October 2026.
All sources fetched 29 October 2026. Percentage changes and ratios described as our arithmetic are calculated from the figures in the tables on this page.
Dennis de Bono
A conversation about one house
This report describes 251 sales. It cannot tell you what your own house is worth, because that turns on the plot, the condition, the aspect and what else is available the week it goes on. If you want that figure, ask for it and I will work it off the comparable evidence for your road rather than off a town-wide median.